Summary
Part I: The Art of Portfolio Construction
The Misunderstood Reality of Possible Stock Market Returns
We start our examination by looking at the common stock focused approach which often includes 60% or more of a portfolio’s allocation to equities.1 We challenge this stock-optimism by presenting a broader analysis of global markets from 1841 to 2019, revealing a higher probability of loss and lower returns over 30 years than commonly believed.2
We show historical instances where a 60/40 stock/bond portfolio faced significant downturns, with major countries experiencing real returns below -40% over a 20-year period, including complete collapses in Russia, China, and Germany due to socio-economic upheavals.3
Most significantly, we look at the distribution of possible returns over a 30 year period, showing that while it is true to say that the average expected return is ~7% per year over a 30-year time horizon, that number hides a much wider range of outcomes.

In the study, the 25th percentile profit on $1 invested is $1.82. This means that there was a 25% chance of an 82% increase (or less) over a 30-year period, a compound growth of 2.02% – much less than the 7% number often touted in the financial media.4
What matters to us, and we think to most investors, is not the theoretical average returns of the market but maximizing the likelihood of doing “good enough.”
While the U.S. market’s 20th-century performance was remarkable, it was not predictable, and future outperformance is not guaranteed. With a non-negligible (12.1%) chance of loss over 30 years, investors might not only fail to accumulate substantial wealth but could also end up with fewer assets than they started with, challenging the notion of stocks as always being a reliable investment over a longer (30-year) period.5
Should Expected Value Drive Your Investment Decisions?
Having said that, we acknowledge that stocks have the highest expected returns of popular asset classes. Yet, we go on to point out nuances around the concept of Expected Value (EV), a fundamental principle in the finance and investment world. The Cockroach whitepaper illustrates this through starkly different outcomes for investors based on the sequence of returns they experience even though the long run expected value of the investment was identical.
It compares the financial trajectories of different individuals based on when strong or flat market returns occurred during their investing lifetimes. The implication here is significant: the average return over a period might not align with the actual outcomes experienced by investors due to timing and cash flow patterns, such as contributions and withdrawals.
For instance, a retired couple, Nick and Nancy, could either thrive or deplete their savings prematurely depending on the order of good and bad return years.

Similarly, the effect of sequence risk is highlighted for a younger investor, Josh, whose final savings amount at retirement could vary drastically based on whether high returns come early or late in his investment horizon.

We suggest that while most investors focus on the EV of an investment, it is more prudent to consider the distribution of potential return paths. This is because real-life inflows and outflows mean that investors do not simply receive the market’s average returns. A strategy that appears to have high average returns but comes with a wide distribution of outcomes may carry more risk than commonly perceived.
The key takeaway is that to achieve the “Dual Mandate of Compound Growth,” investors should not only aim for strong compounding growth but also seek to mitigate large drawdowns and periods of low returns. This approach underscores the importance of not just chasing the highest EV investment but also considering the volatility and sequence of returns to safeguard and grow one’s investments effectively over time.
Stability through Volatility: The Unreasonable Effectiveness of the Permanent Portfolio
Our search for better answers led us to studying many portfolios and asset allocation strategies. The one that stuck out was the work of a little known financial advisor from the 1970s, Mr. Harry Browne.
From his Franklin, TN office, Browne had a key insight about portfolio construction and effective diversification.
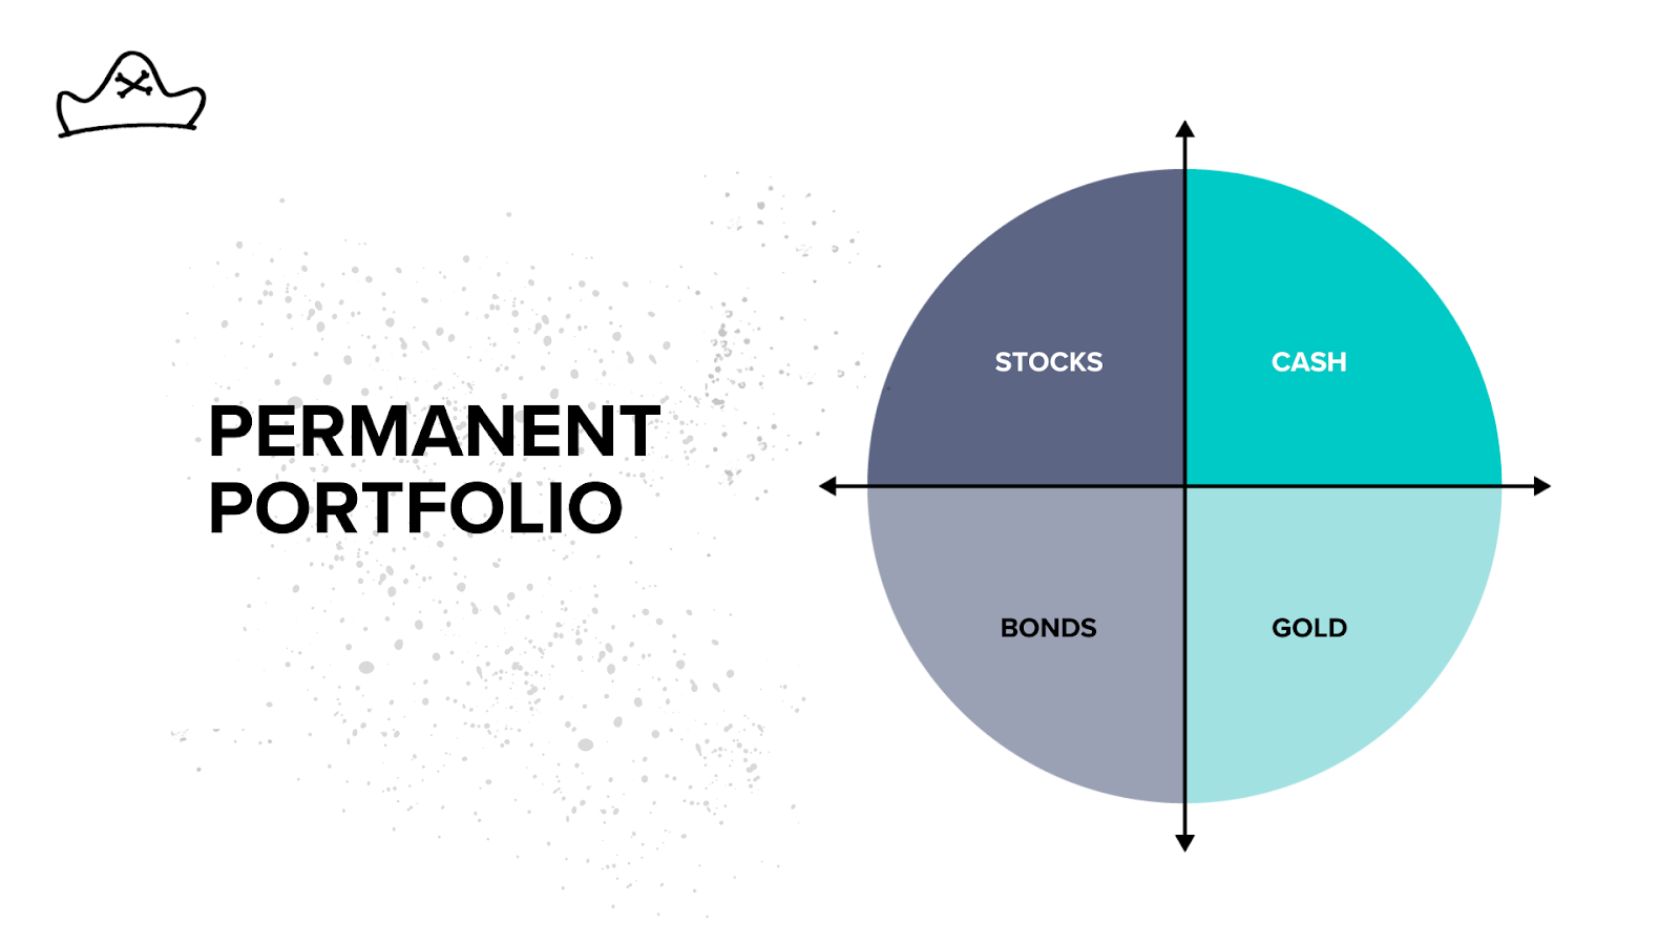
He saw that there were four possible macroeconomic environments: Growth, Decline, Inflation, and Deflation.

He believed that any period of recorded economic history in any country in the world can be fit into one or a combination of these four environments.
While many investors believe they have diversified portfolios, the reality for nearly all investors is that almost everything in their portfolio is designed to do well in only two of these quadrants: growth and deflation.
The most common portfolio construction is a stock and bond focused approach such as the 60% stock /40% bond portfolio which tend to do well in periods of growth with low and stable inflation.
Stock/bond focused portfolios can go through periods such as 1980-1999 or 2010-2019 in the U.S. where they put up big gains. Indeed, most investors alive today have invested overwhelmingly in periods where stocks and bonds performed exceedingly well and so there is a strong bias towards those assets. However, as Harry Browne knew all too well, that hasn’t always been the case.
Adjusting for inflation, the S&P 500 Total Return Index peaked in 1972 and then fell almost 38% by 1982. The S&P 500 Total Return Index didn’t return to its inflation-adjusted 1972 level for 10 years. Bonds did poorly too over the 1970s, which had repeated bouts of high inflation. The real returns of $1,000 invested in a classic 60/40 stock/bond portfolio in 1968 were around zero for 15 years — finishing 1982 at $985.

Source: YCharts, ReSolve Asset Management. The 60/40 Portfolio represents a 60% allocation to the S&P 500 Total Return Index and a 40% allocation to IEF (with GFD extension). Returns are inflation adjusted according to monthly US CPI. This example is for illustrative purposes only, and does not represent trading in actual accounts. PAST PERFORMANCE IS NOT NECESSARILY INDICATIVE OF FUTURE RESULTS.

In some ways, this period would be more challenging than anything most investors alive today have lived through. The recessions caused by the 2008 global financial crisis and COVID were sharp but relatively short-lived. After bottoming out in 2009, the S&P 500 made new all-time highs in 2012 (nominal) and 2013 (real). The COVID recovery was even quicker, with the March 2020 lows being fully recovered by the end of the year.
Imagine something more like the 1970s period. Imagine yourself 15 years older than you are today. What will your life be like? If you have kids, how old will your kids be? What will your career look like? What will your financial needs be? Now imagine that you have less savings than you do today.
What does that imply about your life at that point? Are you able to retire? Pay for your kid’s schooling? Give money to the people or causes that you care about?
Browne lived through a period like this, and it led him to recognize the need for assets that could perform well in periods of low growth or high inflation to help make up for where stock-and-bond-focused portfolios struggled.
Looking at the tools he had available at the time, he came up with a simple yet elegant portfolio:
- 25% in stocks, which should do well in growth
- 25% in cash, which should do well in a decline
- 25% in bonds, which should do well in deflation
- 25% in gold, which should do well in inflation
By directly including assets which should do well in decline and inflation periods like the stagflationary period the U.S. lived through, we believe Browne made a large improvement to the traditional 60% stock/40% bond portfolio. He called his alternative the Permanent Portfolio — permanent, because it was designed to handle each of these macroeconomic regimes, regardless of which showed up.
Let’s take the three principal components of the Permanent Portfolio: Stocks, Bonds, and Gold. Over the period from 1973 to 2022, stocks and bonds were the best returning assets and gold was the worst.6


Based on this, you might think, “I want to get the best long-term performance, so I should invest in bonds and maybe some stocks.”
Well, what happens if we combine all three into an equally weighted portfolio and rebalance it monthly?


The combination of the three does something pretty cool. It performs better than the best performing individual asset — bonds.
Stocks and bonds have the higher returns over this period. Gold has the lowest return and highest drawdown of the three assets, so it would seem like adding it would decrease the overall performance. However, it actually increased it!
The whole Permanent Portfolio is greater than merely the sum of its parts. Adding a lower returning asset — gold — increased the overall portfolio performance.
Gold was mostly uncorrelated with stocks and bonds over this period, meaning it performed well in periods where they did not — most notably in the late 1970s and late 2000s. So even though its overall returns were lower, it delivered those returns at a great time. Rebalancing the gains in gold into stocks and bonds in the late 1970s turned out to be a great trade. Stocks and bonds delivered strong performance in the 1980s and 1990s.
Even though its return was lower, Because gold’s path was complementary — it performed well in a couple of periods where one or both of the other assets struggled — it improved the portfolio meaningfully.
This is the key lesson we took from the permanent portfolio: Adding a lower-returning asset with a complementary (AKA uncorrelated) path can improve the overall portfolio.
Part II: A Brief Review of Popular Investment Assets and Strategies
In Part II of the Cockroach whitepaper, we categorize popular asset classes and look at how they might fit into a broader portfolio. We look at how we might take the lessons learned from the Permanent Portfolio and use more modern tools to apply them most effectively.
Offensive Assets
In our exploration of offensive assets (stocks, bonds and real estate), we find that these investments typically yield considerable gains in times of economic stability and growth, as seen from the mid-1940s to the early 1960s, and again from the mid-1980s to 2007. These assets, however, are not without risk, as they can suffer significant losses during market regime shifts, such as the 2008-2010 financial crisis.
During the initial phases of bull markets, offensive assets thrive as companies can sustainably finance debt expansion through cash flow and growth. This correlation with the business cycle makes them core holdings in a portfolio focused on long-term growth. For instance, stocks, which are highly sensitive to the business cycle, have historically provided the highest long-term returns among major asset classes and are therefore a key component of a growth-focused portfolio. However, the sequence of returns can vary substantially, and there have been extended periods where stock performance has stagnated or fallen.
Real estate investments also align closely with economic growth and have generally performed well in the lifetimes of most current investors, particularly during the high-growth, low-inflation period from 1984 to 2007. Yet, they have historically underperformed during inflationary periods, challenging the notion that real estate is a hedge against inflation.7
Corporate bonds experienced a ‘magic combination’ of falling rates and rising asset prices from 1984 to 2019 but have had mixed performance in other periods, particularly struggling during times of stagflation.
Finally, we show high-quality government bonds, such as U.S. Treasury bonds, have displayed both offensive and defensive characteristics over time. While they have been effective in diversifying stock portfolios from 1990 to 2021, their longer-term performance has been inconsistent, especially during the stagflationary period of the late 1960s to the 1980s.
Our analysis suggests that offensive assets play a pivotal role in wealth accumulation during periods of growth and stability, but they must be balanced with defensive assets to navigate the full spectrum of market conditions, particularly during downturns and high inflation scenarios.
Defensive Assets
In our exploration of defensive assets and strategies (gold, trend following and long volatility and tail risk), we delve into the intricate balance between portfolio protection and growth. Defensive assets have historically been overshadowed by their offensive counterparts due to the latter’s strong performance over the lifetimes of current investors.
We look at gold for its ability to act as an insurance policy against significant fiat devaluation and hyperinflation. Spanning millennia, gold has maintained its purchasing power,8
demonstrating its efficacy in extreme economic conditions. However, our research indicates that gold may not offer the same diversification benefits in milder inflationary periods and that it’s 1970s performance may be the exception rather than the rule.
Our analysis continues with the examination of commodities. Given that inflation often reflects the rise in costs of goods and services which rely on commodities, a diversified basket of commodities serves as a logical hedge against inflation. We look at how employing an all asset trend strategy that includes significant commodity exposure may be the most robust inflation hedge and most additive to an offensive-focused portfolio.
The Cockroach whitepaper also delves into long volatility and tail risk strategies. We address the question of why investors would consider a defensive strategy that, in isolation, may demonstrate a loss over time. Through the lens of a diversified portfolio, we suggest that the inclusion of a defensive strategy, such as tail risk, can paradoxically enhance long-term returns. This counterintuitive outcome arises from the defensive strategy’s ability to perform during market downturns, enabling the rebalancing of a portfolio towards offensive assets at opportune moments.
Part III: The Cockroach Portfolio
Finally, we present the Cockroach Portfolio. We began working on the Cockroach Portfolio in 2018, originally under the name Ataraxia, a Greek word meaning “calmness untroubled by mental or emotional disquiet.”
Our goal has always been to construct a portfolio that best accomplished our dual mandate of portfolio construction. Cockroaches aren’t cuddly, but they do two things well that we also want out of our portfolios: they’re really hard to kill, and they compound fast.
Cockroaches have been around for 320 million years. By evolutionary standards, they are a remarkably successful species. But no one would call them “smart.” They don’t have iPhones or nuclear physics or know how to forecast the weather. They don’t know much about predicting the future. The Cockroach Portfolio is based on that idea. Suppose you didn’t think you could predict the future; how would you build a portfolio?
Fractal Diversification
We build on the strategies presented in Part II and show how each strategy can be enhanced through fractal diversification—a methodology that amplifies the resilience of an investment strategy by diversifying not just across the major macroeconomic regimes but within them.
The Cockroach Portfolio embraces diversification not just across the four major macroeconomic quadrants, but within them. It is not just a collection of assets but a carefully curated ensemble of sub-strategies within four fundamental quadrants:
- Global Stocks for growth
- Income for deflation
- Trend Following (Trend) for inflation
- Long Volatility and Tail Risk (Volatility) for decline

In the realm of stocks, the Cockroach Portfolio doesn’t rely solely on U.S. indices. Instead, it embraces a global perspective, including developed and emerging markets, to capitalize on growth wherever it may occur. This global approach addresses the alternating periods of outperformance between international and U.S. stocks and mitigates the risk of home-country bias, which can result in significant underperformance relative to global indices.
The Income quadrant extends beyond U.S. Treasuries, incorporating a broad spectrum of global bond exposure and alternative income strategies like carry trades.
Trend Following diversifies across various lookback periods and markets, employing numerous monetization techniques to adapt to changing market conditions.
When it comes to Long Volatility and Tail Risk, the portfolio employs a blend of sub-strategies, including long options, relative value, and tail risk strategies, designed to provide robust performance in sharp market downturns.
Additionally, the portfolio includes a fiat hedge, predominantly gold, and a prudent allocation to cryptocurrencies, Bitcoin and Ethereum, to safeguard against high inflation or currency devaluation.
We acknowledge that because future returns and correlations of strategies are unknowable, opinions may vary regarding their inclusion and weighting.
In particular, we stress the importance of a substantial allocation to defensive assets and strategies, as they are critical to enhancing long-term compounding potential. We believe that investors should prioritize the best long-term strategy over short-term peer comparisons, avoiding the temptation to abandon a prudent strategy at inopportune moments.
We show that with a simple permanent portfolio, the experience of long-term superior performance can feel disappointing. Over any shorter period of a year or two or five, one individual asset is likely to outperform the whole portfolio.

If you’re always comparing the overall portfolio performance to its highest performing asset in the last year, you’re setting yourself up to feel disappointed and underperform in the long run.
The hardest part of the Cockroach Portfolio approach is sticking with it. It’s not a coincidence that a diversified strategy like the Cockroach Portfolio is hard to stick with. Just when an asset class or strategy is most hated is often when it is poised to succeed.
- We use 60% as a threshold for being heavily concentrated in stocks due to the historically higher volatility of stocks compared to other asset classes. Even in a fairly conservative portfolio consisting of 55%stocks and 45% other assets, that 55% in stocks carries 87% of the portfolio’s risk. To give an overly simplistic example, if you have a portfolio with 60% in stocks and 40% in cash, the cash isn’t likely to go down by 20% in a year, whereas this type of behavior is well within the norm for stocks. Many other common asset classes (e.g. bonds, Real Estate) have historically had much lower volatility than stocks. That means most of the “risk” — that your portfolio's value could fall — is in the stocks holdings.
Generally the terms “risk” and “volatility” are used interchangeably in finance because the Capital Asset Pricing Model defines risk as the volatility of returns. The concept of “risk and return” is that riskier assets should have higher expected returns to compensate investors for the higher volatility and increased risk. Though I could write another paper on the many issues with equating volatility and risk, I will use the terms here in that way to stick with the accepted convention. Source: https://www.institutionalinvestor.com/article/2bswrhqnqgdyo78ldzabk/portfolio/aqr-the-60-40-portfolio-wont-protect-investors-anymore
- Anarkulova, Aizhan and Cederburg, Scott and O'Doherty, Michael S., Stocks for the Long Run? Evidence from a Broad Sample of Developed Markets (January 18, 2021). The study characterized the distribution of long-term equity returns using bootstrap simulations based on the historical record of stock market performance in a broad cross section of 39 developed countries over the period from 1841 to 2018.
- Dalio, Ray. A Changing World Order. Avid Reader Press / Simon & Schuster, 2021. Past performance is not necessarily indicative of future results.
- Anarkulova et al.
- Ibid.
- We selected this period because it was the longest period for which we are able to get what we considered reliable data. A lot of asset allocation backtests tend to start with 1973 because global equities, commodities, and currencies tend to have more issues pre-1972. Of course, it would be interesting to see a longer period, but given that this is intended merely as an instructive example of investing over one lifetime, a ~49 year period seems like a suitable one and contains some periods of inflation, deflation, growth and decline. If anything, my guess would be that this period in the U.S. is more skewed to deflation and growth. I suspect that a longer term, more international track record (say globally back to 1800) would have more inflation and more declines but that’s just a hunch based on a broad reading of financial history and not something I have hard data for.
- Neville, Henry and Draaisma, Teun and Funnell, Ben and Harvey, Campbell R. and van Hemert, Otto, The Best Strategies for Inflationary Times (May 25, 2021).
- Source: Erb, Claude B. and Harvey, Campbell R., The Golden Dilemma (May 4, 2013). Financial Analysts Journal, vol. 69, no. 4 (July/August 2013) 10-42.